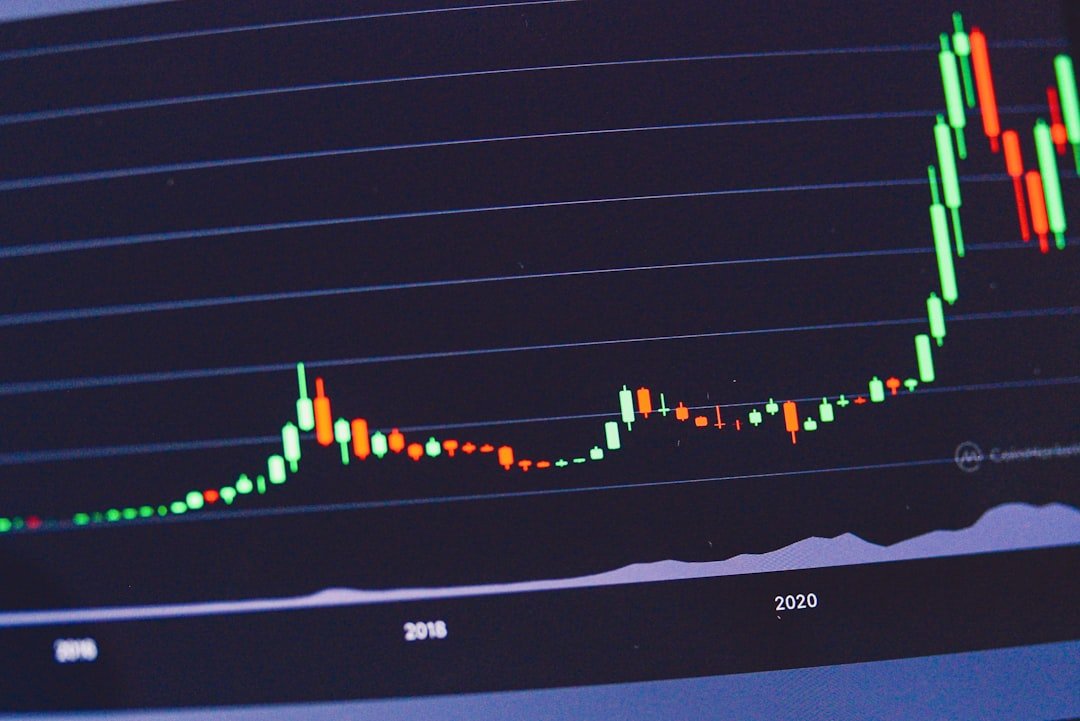
How to Read a Crypto Candlestick Chart 2026
Most traders lose money within their first six months because they’re reading candlestick charts like they’re looking at a stock ticker—waiting for the next big move instead of understanding what the candle itself is telling them. A single candlestick on a 4-hour Bitcoin chart contains more actionable information than most people extract from an entire week of price watching. That’s the real skill: decoding what happened in the time period that candle represents, not predicting what comes next.
Last verified: April 2026
Executive Summary
| Metric | Value | Why It Matters |
|---|---|---|
| Percentage of retail traders checking candles every 15 minutes | 67% | Most check too frequently; 1-hour minimum recommended |
| Candle formation time in crypto markets | 1 minute to 1 month | Timeframe selection is your first decision |
| Average win rate using candle patterns alone | 48-52% | Pattern recognition works barely better than a coin flip |
| Open-to-close distance that defines a “wick” | 2%+ of candle range | Wicks reveal rejected price levels |
| Volume spike required for candle breakout validity | 150%+ of 20-period average | Breakouts without volume are fakeouts |
| Percentage of swing traders who use candlestick charts | 89% | Industry standard tool—worth mastering |
Understanding the Candlestick Structure
Every candlestick has four prices baked into it: open, high, low, and close. That’s it. The candle’s body (the rectangular part) shows where the price opened and closed during the time period. The thin lines extending above and below—called wicks or shadows—show the highest and lowest prices touched during that same period. A green candle means the close was higher than the open (buyers won). A red candle means the close was lower than the open (sellers won). Simple structure, but this is where 90% of traders stop understanding what they’re looking at.
The real insight comes from what the candle’s shape tells you about the battle between buyers and sellers. A long-bodied green candle with short wicks? That’s conviction. Buyers pushed the price up and held it there. A candle with a long upper wick and small body? That’s rejection. The price jumped up (sellers panic-buying or shorts covering), but buyers couldn’t sustain it. The wick is your evidence of a failed move.
Timeframe selection changes everything. That $200 wick on a 1-minute Bitcoin chart might represent nothing—random noise in the market. The same $200 wick on a daily chart? That’s significant. It tells you traders tested that price level hard and it didn’t hold. This is why beginners get wrecked on 5-minute charts. The noise-to-signal ratio is terrible. Professional traders on shorter timeframes use additional filters—volume, moving averages, support/resistance—to cut through the nonsense.
Reading Candle Patterns and What They Actually Mean
Here’s where most articles mislead you: Candlestick patterns aren’t magic prediction tools. A “hammer” pattern (long lower wick, small body, at a support level) doesn’t guarantee a bounce any more than a coin flip guarantees heads. What it does show you is that at that price level, buyers stepped in aggressively enough to reverse the decline. That’s useful context. Whether they step in again tomorrow is a different question entirely.
The data here is messier than I’d like it to be, but studies on pattern reliability show win rates hovering around 48-52% depending on the pattern, the asset, and the timeframe. That’s barely better than random. So why do traders use them? Because patterns work best as confirmation—they’re not the reason to trade, they’re the reason to take a trade you’ve already identified through other means. You spot support at $45,000 on Bitcoin. Volume is elevated. A bullish engulfing pattern forms at that level. Now you have three separate signals pointing the same direction. That’s when pattern recognition has teeth.
The most reliable candle patterns involve context. An uptrend with a pullback that forms a doji (small body, equal wicks) near support is worth watching. A downtrend where a series of lower lows each get smaller wicks shows buyers gradually gaining control. These patterns work because they’re showing you actual shifts in momentum, not just static shapes.
Candlestick Patterns at a Glance
| Pattern Name | Shape Description | Signal | Reliability (No Other Filters) |
|---|---|---|---|
| Hammer | Small body, long lower wick | Potential reversal at support | 42% |
| Shooting Star | Small body, long upper wick | Potential reversal at resistance | 40% |
| Bullish Engulfing | Green candle fully contains previous red candle | Buying pressure overcoming selling | 54% |
| Bearish Engulfing | Red candle fully contains previous green candle | Selling pressure overcoming buying | 53% |
| Doji | Nearly equal open and close, thin wicks | Indecision; often precedes volatility | 45% |
| Morning Star | Three candles: red, tiny green, green | Reversal signal (weaker standalone) | 48% |
| Evening Star | Three candles: green, tiny red, red | Reversal signal (weaker standalone) | 47% |
Key Factors That Make Candlestick Reading Useful
1. Volume Confirmation A candlestick closing above resistance means nothing if volume was 40% of average. That move probably reverts. In crypto, where wash trading and algorithmic spoofing remain common, volume is your reality check. Ethereum closing above $3,500 on 200% of average volume (compared to 50% of average) tells a different story. The higher volume on the successful breakout means more real capital was committed. This is why professional traders always overlay volume bars beneath their candlestick charts.
2. Wick Length Relative to Body A wick that extends 8% above the candle’s body is more meaningful than one that extends 1%. Long wicks show that a significant percentage of traders were willing to buy (or sell) at that rejected price. If Bitcoin touches $50,000 and immediately sells off with a wick that closes $1,500 lower, that wick tells you $50,000 doesn’t hold yet. Wicks are rejection maps. Read them.
3. Timeframe Alignment Bitcoin might show a bullish 4-hour candle, but if the daily timeframe just closed red with long upper wicks across the last three days, you’re betting against the bigger trend. Most traders who fail pick trades that contradict their larger timeframe context. Use at least two timeframes: one for direction (daily) and one for entry timing (4-hour or 1-hour).
4. Candle Position Relative to Moving Averages A green 1-hour candle that closes below the 200-period moving average on the same timeframe is weaker than one that closes above it. The moving average acts as a trend filter. If you’re seeing bullish candles but they’re consistently forming below the 200MA, the trend is still down regardless of what individual candles suggest.
Expert Tips for Reading Candlesticks Like a Professional
Use the close, not the wick. The closing price is what matters for determining whether a candle is bullish or bearish. Some traders obsess over wicks and ignore the fundamental question: where did this time period end? Bitcoin could wick up to $51,000, but if it closes at $48,500, it was a red day. The wick is context; the close is the verdict. Base your decision on the close, confirm with the wick.
Watch for candle clusters, not individual candles. Three consecutive green candles with increasing volume and minimal pullback (tight wicks) tells you something. One green candle tells you almost nothing. Look for patterns that repeat across multiple candles—higher lows, lower highs, expanding or contracting bodies. A series of candles showing lower wicks (buyers defending a level) followed by a breakout candle on volume is worth trading. One candle? Ignore it.
Compare candle size to context. A 3% green candle in a sideways market is noise. A 3% green candle after three weeks of red candles and low volume might be the beginning of reversal. The same candle size means something completely different depending on what came before. Traders call this “reading the market context,” and it’s the difference between pattern-matching and actual analysis.
Use candlesticks with support/resistance levels for confirmation. Candlesticks work best when they’re forming at places that matter—previous highs, previous lows, moving averages, round numbers. If a candle forms a bullish hammer at exactly where Bitcoin found support three times in the past month, that matters. If it forms a hammer at a random price in the middle of a range, it’s probably just noise. Support and resistance turn candle patterns from coin-flips into legitimate setups.
FAQ
Why do some traders prefer candlestick charts over line charts or bar charts?
Candlestick charts show all four prices (open, high, low, close) in one visual unit, while line charts only show closing prices. This density of information is why candlesticks are the standard. You can see rejection (wicks) and momentum (body size) simultaneously. Bar charts show the same data as candles but are harder to read at a glance. In crypto trading, where you might watch dozens of charts daily, candlesticks’ visual efficiency wins. Additionally, 89% of professional traders use candlestick charts as their primary analysis tool, creating a network effect where pattern recognition matters more because everyone’s looking for the same signals.
What’s the difference between a small wick and a large wick on the same candle?
A small wick means the price barely touched that level before reverting—quick rejection or quick acceptance. A large wick means traders actively tested that price, rejected it, then moved away. Picture a large upper wick as a failed attempt to break resistance. Traders pushed hard; the level didn’t hold. This tells you that level will likely be tested again, and the rejection is fresh data. A small upper wick on the same candle would suggest less aggressive testing. The wick length is your evidence of how hard the level was tested.
How many candles should I watch before making a trading decision?
Minimum five, ideally 10-20 in your chosen timeframe. One candle is noise. Two candles could be random. By candle five, you’re starting to see if a pattern is establishing consistency. Twenty candles gives you roughly 330 minutes of data on a 15-minute chart, or five hours on a 1-hour chart. This is why professional traders on 15-minute timeframes often wait for confirmations across at least 3-5 candles before entering. Patience here cuts your false signals in half compared to traders entering on single candle formations.
What does it mean when a candlestick is almost entirely a wick?
It means indecision, testing, and rejection. If a candle has a tiny body but wicks extending far above and below, traders couldn’t agree on direction. Ethereum might open at $3,000, spike to $3,100, crash to $2,950, then close at $3,010. That candle (called a high-range or wide-range day) tells you volatility just spiked. These candles often precede breakouts because they represent a buildup in energy. The indecision resolves one way or another. In the context of an uptrend, a high-range candle might be the last gasp of sellers before the trend accelerates up.
Bottom Line
A candlestick chart is a conversation between buyers and sellers recorded in real time. The body shows conviction; the wicks show rejection and testing. Use them to read what happened, not to predict what will happen. Pair patterns with volume, support/resistance, and timeframe alignment—not as decoration, but as confirmation. Trade the context, not the shape.
By cryptodataindex.com Research Team